
We’ve all been there: standing in a crowded café, staring at our phone’s full 4 or 5 signal bars, yet waiting endlessly for a webpage to load or a video to buffer. It’s a frustrating paradox that raises a fundamental question: if signal bars are supposed to tell us how good our connection is, why do they so often lie? As someone who studied wireless communication systems and signal processing, I’ve long been fascinated by this disconnect between perception and reality. Signal bars are not a measure of internet speed—they’re a crude indicator of your phone’s connection strength to a nearby cell tower. To truly understand your network performance, we need to look beyond the bars, unpack the science of dBm (the unit of signal strength), distinguish between connection strength and data throughput, and learn how to test what matters most: actual speed.
Let’s start with why signal bars are an unreliable metric. Unlike standardized measurements like temperature or weight, there’s no universal industry standard for how phone manufacturers map signal strength to bars. One brand might display 4 bars for a signal of -80 dBm (a decent connection), while another uses 4 bars for -95 dBm (a weaker signal). This inconsistency means bars are at best a rough estimate, not a precise measurement. The core issue is what bars measure: Received Signal Strength Indicator (RSSI), which quantifies how well your phone can “hear” the cell tower. But internet speed depends on far more than just signal strength—it relies on network congestion (how many other users are on the same tower), bandwidth allocation, network type (5G, LTE, or 3G), and interference from buildings or terrain. A strong signal (-70 dBm) on a congested tower during rush hour can deliver slower speeds than a weaker signal (-90 dBm) on an uncongested tower at 2 AM.
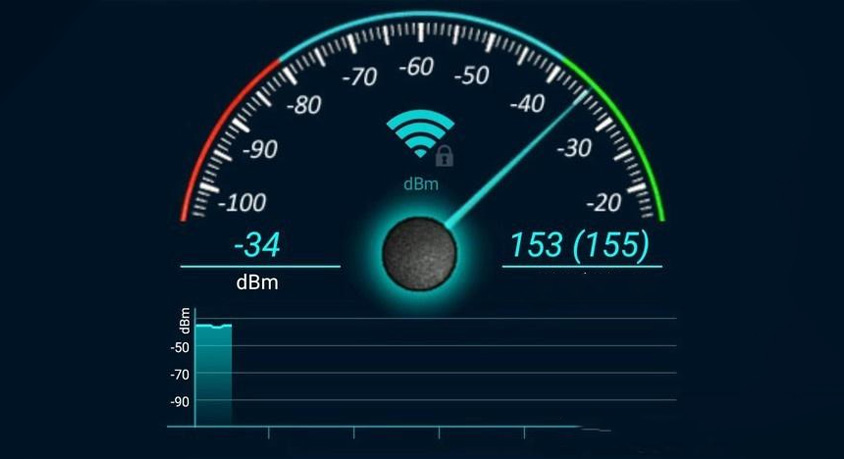
To move beyond bars, we need to understand dBm, the scientific unit of signal strength. dBm (decibels relative to one milliwatt) measures the radio signal’s power, expressed as a negative number—closer to 0 means stronger. For context: -50 to -70 dBm is excellent (fast speeds, no dropped calls), -70 to -90 dBm is good (reliable streaming/browsing), -90 to -110 dBm is poor (spotty connections), and below -110 dBm is nearly unusable. Translating to real use: -75 dBm streams 4K video seamlessly, while -105 dBm struggles with text-based sites. Most modern phones let you access raw dBm data via hidden “engineering mode” or settings—no technical skills needed. This number removes bar-related guesswork, giving an objective measure of your tower connection.
Equally important is knowing your network type, as 5G doesn’t always outpace LTE. While 5G can hit 10 Gbps in ideal conditions, many urban “sub-6 GHz” 5G deployments offer LTE-like speeds with better capacity. “mmWave” 5G (faster but shorter-range) is limited to specific locations. A phone showing “5G” with -100 dBm might deliver 20 Mbps, while an LTE connection with -80 dBm could hit 100 Mbps. Checking both dBm and network type is critical—they work together to explain potential speed.
The final step is testing actual throughput (download/upload speeds) with speed test apps. These apps measure real data transfer rates, accounting for congestion, bandwidth, and network type—factors bars ignore. A 2023 study found bars correlated with speed only 45% of the time, while dBm plus speed tests predicted performance 82% of the time. For example, 5 bars might test at 10 Mbps (too slow for streaming), while 3 bars could hit 80 Mbps (perfect for 4K). Regular tests identify patterns like evening congestion or basement dead zones, enabling targeted fixes.
Three practical products enhance signal and speed management. A signal strength monitoring app displays real-time dBm, network type, and tower info in a user-friendly interface—ideal for remote workers or travelers needing reliable video call spots. Its downside: some require location permissions or show ads. A portable cell signal booster amplifies weak signals (down to -110 dBm) by capturing and retransmitting tower signals, improving speeds 2-3x in rural areas or basements. It’s bulkier than phone accessories and needs outdoor placement (e.g., a window), making it less suited for city dwellers with good baseline coverage. A high-speed Wi-Fi extender complements cellular management by fixing indoor Wi-Fi dead zones, but relies on an existing network—no help for cellular issues.
Real-world scenarios highlight these tools’ value. For remote workers, the monitoring app identifies optimal home spots (e.g., -72 dBm LTE near a window) to avoid dropped calls, while the Wi-Fi extender ensures office connectivity. For road trippers, the portable booster turns an unusable -115 dBm signal into a usable -90 dBm, enabling map checks and messages.
Common misconceptions need clarification: more bars don’t equal faster speed, but a strong signal (above -80 dBm) is a prerequisite for fast speeds. Below -100 dBm, even uncongested networks struggle to exceed 10 Mbps. 5G isn’t inherently faster than LTE—always test speeds. Run multiple tests at different times to account for temporary congestion.
In summary, signal bars are a flawed, brand-specific indicator of connection strength—not speed. The key to reliable performance is understanding dBm, verifying network type, and testing actual speeds. The monitoring app is essential for all users; the portable booster benefits rural/weak-signal users; the Wi-Fi extender solves indoor coverage gaps. By focusing on these metrics and tools, you can stop relying on misleading bars and take control of your internet experience. The goal isn’t to chase more bars—it’s to chase consistent, measurable speeds that match your needs.
Disclaimer: Mention of any brand or trademark is for identification purposes only and does not indicate any partnership or endorsement.
